|
|
|
When Governor DeWine issued his mask mandate for Ohio on 7/24/20, he began an experiment. It has been said that if we all wore masks for 4-6 weeks, the pandemic would be under control. Here we are, over two months later, and, well, I think the data speaks for itself. I graphed the data below using numbers directly from the ODH website. Just to show that I'm not trying to pull a fast one, I've also included a screenshot of their own graph from today. Masks are most definitely being worn in OH by most people. In fact, they are even being worn in situations where they are totally useless (like while driving alone in a car). Yet, the daily case trend stays the same, and recently it's started increasing. Mr. DeWine, your experiment has failed. 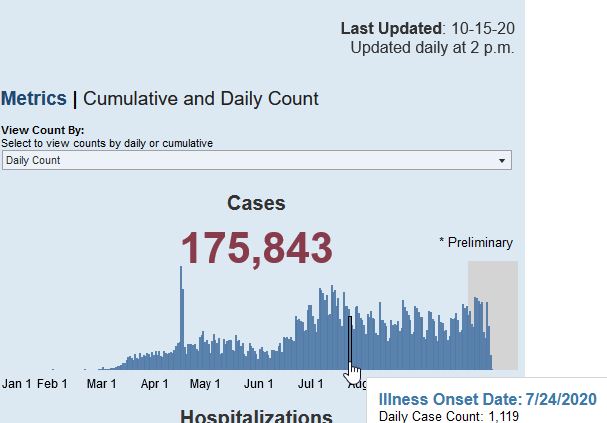
0 Comments
Straight from the mouth of a politician. They know they truth, but will only say it when they think they're not on camera. Ooops!
https://twitter.com/yrnf/status/1311065135667204096 This is an interesting read. One trial showed that hospital workers were more likely to catch an ILI when wearing masks vs no masks at all. Excerpt and full article here:
Only one randomised trial (n=569) included cloth masks. This trial found ILI rates were 13 times higher in Vietnamese hospital workers allocated to cloth masks compared to medical/surgical masks, RR 13.25, (95%CI 1.74 to 100.97) and over three times higher when compared to no masks, RR 3.49 (95%CI 1.00 to 12.17). 4 https://www.cebm.net/covid-19/masking-lack-of-evidence-with-politics/ Here are the latest CDC estimates grouped by age. Let this sink in: if you're under 70, your chance of surviving COVID-19 is over 99.5% 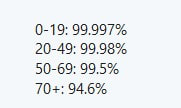 https://www.cdc.gov/coronavirus/2019-ncov/hcp/planning-scenarios.htmlwww.cdc.gov/coronavirus/2019-ncov/hcp/planning-scenarios.html
Here is my updated graph showing the daily number of COVID cases in Ohio. Data after 8/28 is still preliminary, so it's not included. The mandate went into effect on 7/24, and as you can see, there is still the usual daily fluctuation. If masks were having a positive effect, shouldn't the number of daily cases be steadily decreasing?  Another fair question as ask is, how many daily cases were there before the mandate? Here is a graph: 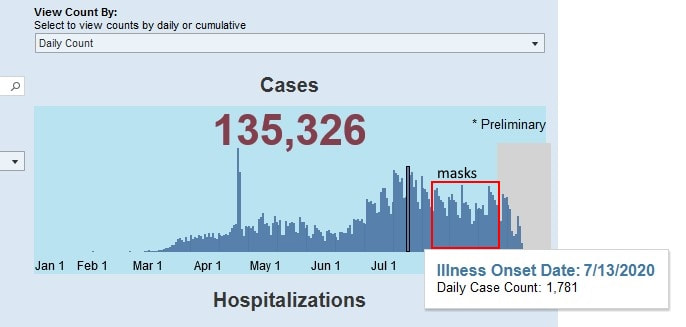 As we see, the peak in OH was actually on 7/13/2020. There was also a very brief peak in mid-April. Mask usage was not common in the beginning of the pandemic, yet the cases remained relatively stable for many months, until June, when they started climbing. It would appear that mask usage (or not) seems to have little affect on the outcome. I suspect other factors are at play. For example, does the rapid increase in daily cases in June correspond to when we began ramping up testing in OH?
Data obtained from: https://coronavirus.ohio.gov/wps/portal/gov/covid-19/dashboards/overview Here is an interesting article from WebMD. Early estimates predict that the overall recovery rate from COVID-19 is between 97% and 99.75%. Let that sink in. https://www.webmd.com/lung/covid-recovery-overview#1 In case it gets removed, here is a screenshot: 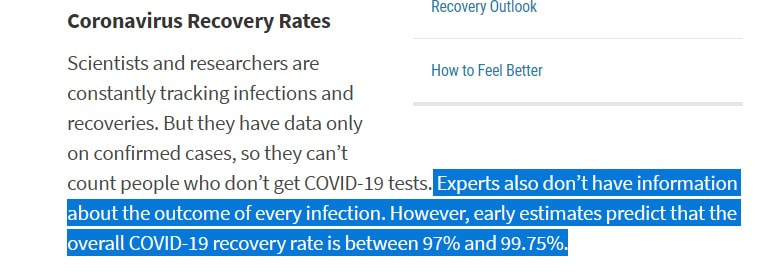 This is another example of info that is being censored by Big Tech, including Twitter.
|
Archives
May 2021
Categories |
 RSS Feed
