|
|
|
Here is my updated graph showing the daily number of COVID cases in Ohio. Data after 8/28 is still preliminary, so it's not included. The mandate went into effect on 7/24, and as you can see, there is still the usual daily fluctuation. If masks were having a positive effect, shouldn't the number of daily cases be steadily decreasing?  Another fair question as ask is, how many daily cases were there before the mandate? Here is a graph: 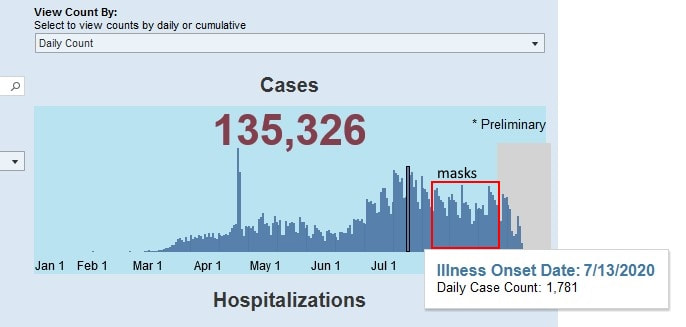 As we see, the peak in OH was actually on 7/13/2020. There was also a very brief peak in mid-April. Mask usage was not common in the beginning of the pandemic, yet the cases remained relatively stable for many months, until June, when they started climbing. It would appear that mask usage (or not) seems to have little affect on the outcome. I suspect other factors are at play. For example, does the rapid increase in daily cases in June correspond to when we began ramping up testing in OH?
Data obtained from: https://coronavirus.ohio.gov/wps/portal/gov/covid-19/dashboards/overview
0 Comments
Leave a Reply. |
Archives
May 2021
Categories |
 RSS Feed
